This term, in Maths, we are learning about statistics. As part of our learning we are examining data related to our health . The first part of our examination we collected data (information) about the food we ate for one week (2/2 to 9/2) .
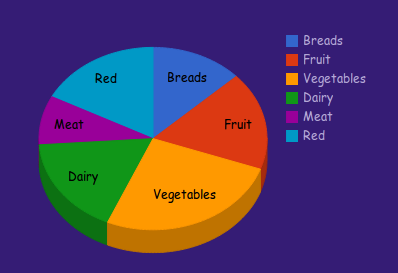
The graph (or chart) shows how much i ate from six major food groups .
No comments:
Post a Comment
Note: Only a member of this blog may post a comment.